No products, prices, or picks here — just the math, from university Extension methods. Internal links only.
Your sprinkler controller says 20 minutes. Your lawn says something else. The only way to know how much water a zone actually puts down is to catch it — and that takes six cans, a ruler, and ten minutes, not a new controller.
The calculator
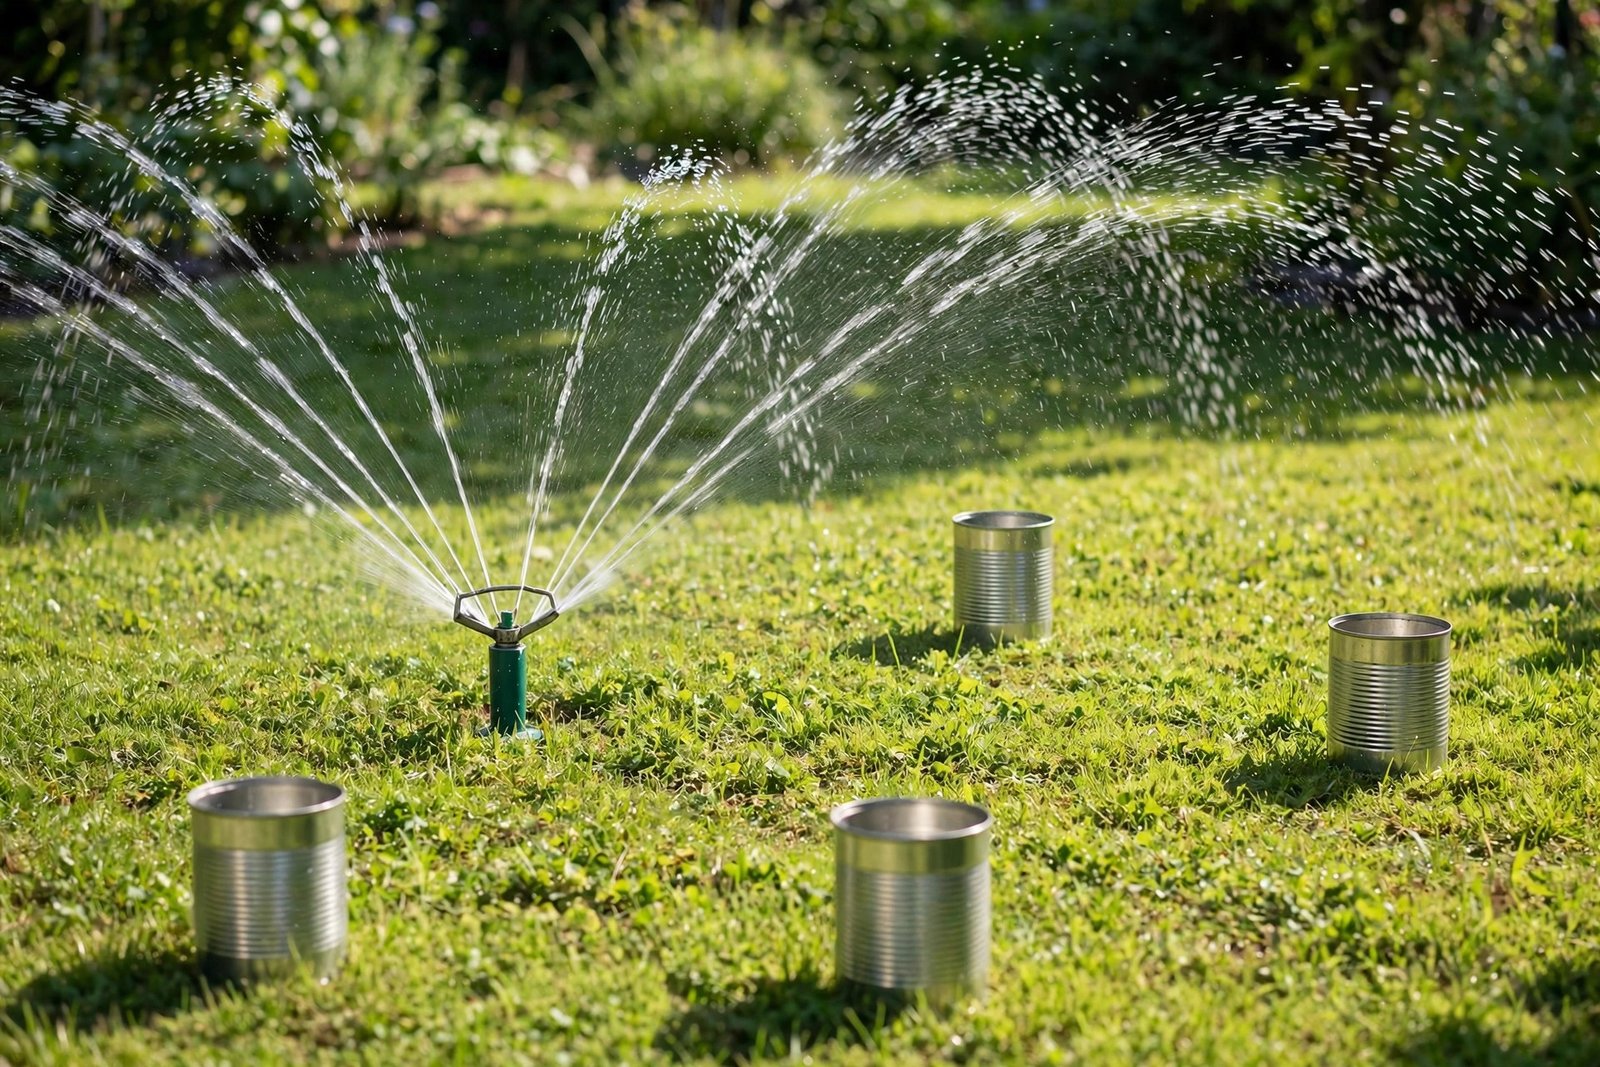
What you need: six identical straight-sided cans of soup- or vegetable-can height (or calibrated catch cups), set level between sprinkler heads in one zone. Do not use short tuna or cat-food cans — Colorado State Extension warns they are too shallow and water splashes out, which under-reads your depth. Run one zone at a time, for a timed run, then measure each can’s depth with a ruler to the nearest tenth of an inch.
Enter your catch-can depths (inches)
How the math works
Average depth = the sum of your can depths divided by the number of cans you entered. Precipitation rate (inches per hour) = average depth divided by run time in minutes, times 60. Minutes to apply your target depth = target depth divided by the precipitation rate, times 60.
That is the Utah State method, and Colorado State’s six-can shortcut is the same math in disguise. With six cans and a 10-minute run, the average depth times 6 equals the precipitation rate — and six times the average is the combined depth you get by pouring all six cans into one. So a combined depth of 1.2 inches after 10 minutes means a precipitation rate of 1.2 inches per hour by both methods. Two Extensions, one answer.
The evenness flag is a rough read, not a formal uniformity score. It compares your lowest can to the average: if the lowest is less than half the average, the tool prompts you to check those heads. Formal distribution uniformity averages the lowest quarter of readings and needs more cans than a six-can home test reliably supports, so this tool never calls its flag a uniformity percentage.
Worked examples (static fallback — works with JavaScript off)
Example 1. Six cans read 0.1, 0.2, 0.2, 0.2, 0.2, and 0.3 inches after a 10-minute run. The sum is 1.2, the average is 0.2, and 0.2 divided by 10 times 60 gives a precipitation rate of 1.2 inches per hour. To apply 0.5 inches at that rate takes 0.5 divided by 1.2 times 60, or 25 minutes.
Example 2 (Utah State). A precipitation rate of 1 inch per hour applies 0.5 inches in 30 minutes. Same formula, same answer.
Blocked-head example. Cans read 0.3, 0.3, 0.0, 0.3, 0.3, and 0.3 inches over 15 minutes. The average is 0.25 inches, the rate is 1.0 inch per hour, and the lowest can (0.0) is far below the average — check that head before trusting the average.
Runtime table: minutes to apply a target depth
| Precipitation rate | 0.25 in | 0.5 in | 1.0 in |
|---|---|---|---|
| 0.25 in/hr | 60 min | 120 min | 240 min |
| 0.5 in/hr | 30 min | 60 min | 120 min |
| 0.75 in/hr | 20 min | 40 min | 80 min |
| 1.0 in/hr | 15 min | 30 min | 60 min |
| 1.25 in/hr | 12 min | 24 min | 48 min |
| 1.5 in/hr | 10 min | 20 min | 40 min |
| 2.0 in/hr | 7.5 min | 15 min | 30 min |
Typical bands, for sense-checking only — never as your own rate: Colorado State gives pop-up spray heads at 1 to 2.5 inches per hour and rotors at 0.25 to 0.75 inches per hour. A rotor zone measuring 0.5 inches per hour sits inside its band; a spray zone at 1.75 does the same. Your measured rate is what your controller should use.
Doing the test well
Place the cans scattered between heads in one zone, level, not blocking the spray — Utah State suggests one near each head and one halfway between heads. Test one zone at a time, because zones differ in head type, pressure, and spacing. If some cans hold much more or much less than the rest, Colorado State’s note applies: the system is poorly designed or a head is malfunctioning. Inspect those heads — a sunken, blocked, or misaligned head is a maintenance job, not a calculator input.
Where two zones water the same area, Colorado State’s rule is to halve each zone’s run time, so each applies half the needed water. On slopes or compacted clay, split long runs into cycles with soak time between them — cycle and soak — so water soaks in instead of running off.
What this calculator does not do
It does not schedule watering — how often per week. Colorado State’s weekly tables are Colorado cool-season figures, cited here as an example only, not built in as a national schedule. It does not measure formal distribution uniformity, soil moisture, or evapotranspiration, and it takes no live weather data. It does not diagnose heads: a dry or low can is a prompt to inspect that head, not a diagnosis. And it does not set controller programs for multi-zone overlap beyond the halve-the-time rule; test each zone separately.
Sources
- Colorado State University Extension, “Methods to Schedule Home Lawn Irrigation” (CMG GardenNotes #265) — https://extension.colostate.edu/resource/methods-to-schedule-home-lawn-irrigation/ — fetched in full Oct 31, 2026.
- Utah State University Extension, “Simple Sprinkler Performance Testing for Salt Lake County” (Horticulture/Turfgrass 2013-15pr, Kopp/Allen/Wagner, May 2013) — http://extension.usu.edu/files/publications/publication/Horticulture_Turfgrass_2013-15pr.pdf — fetched in full Oct 31, 2026.
Related reading: our grass-seed calculator for seeding rates, and the watering-timing guides in Lawn Care.