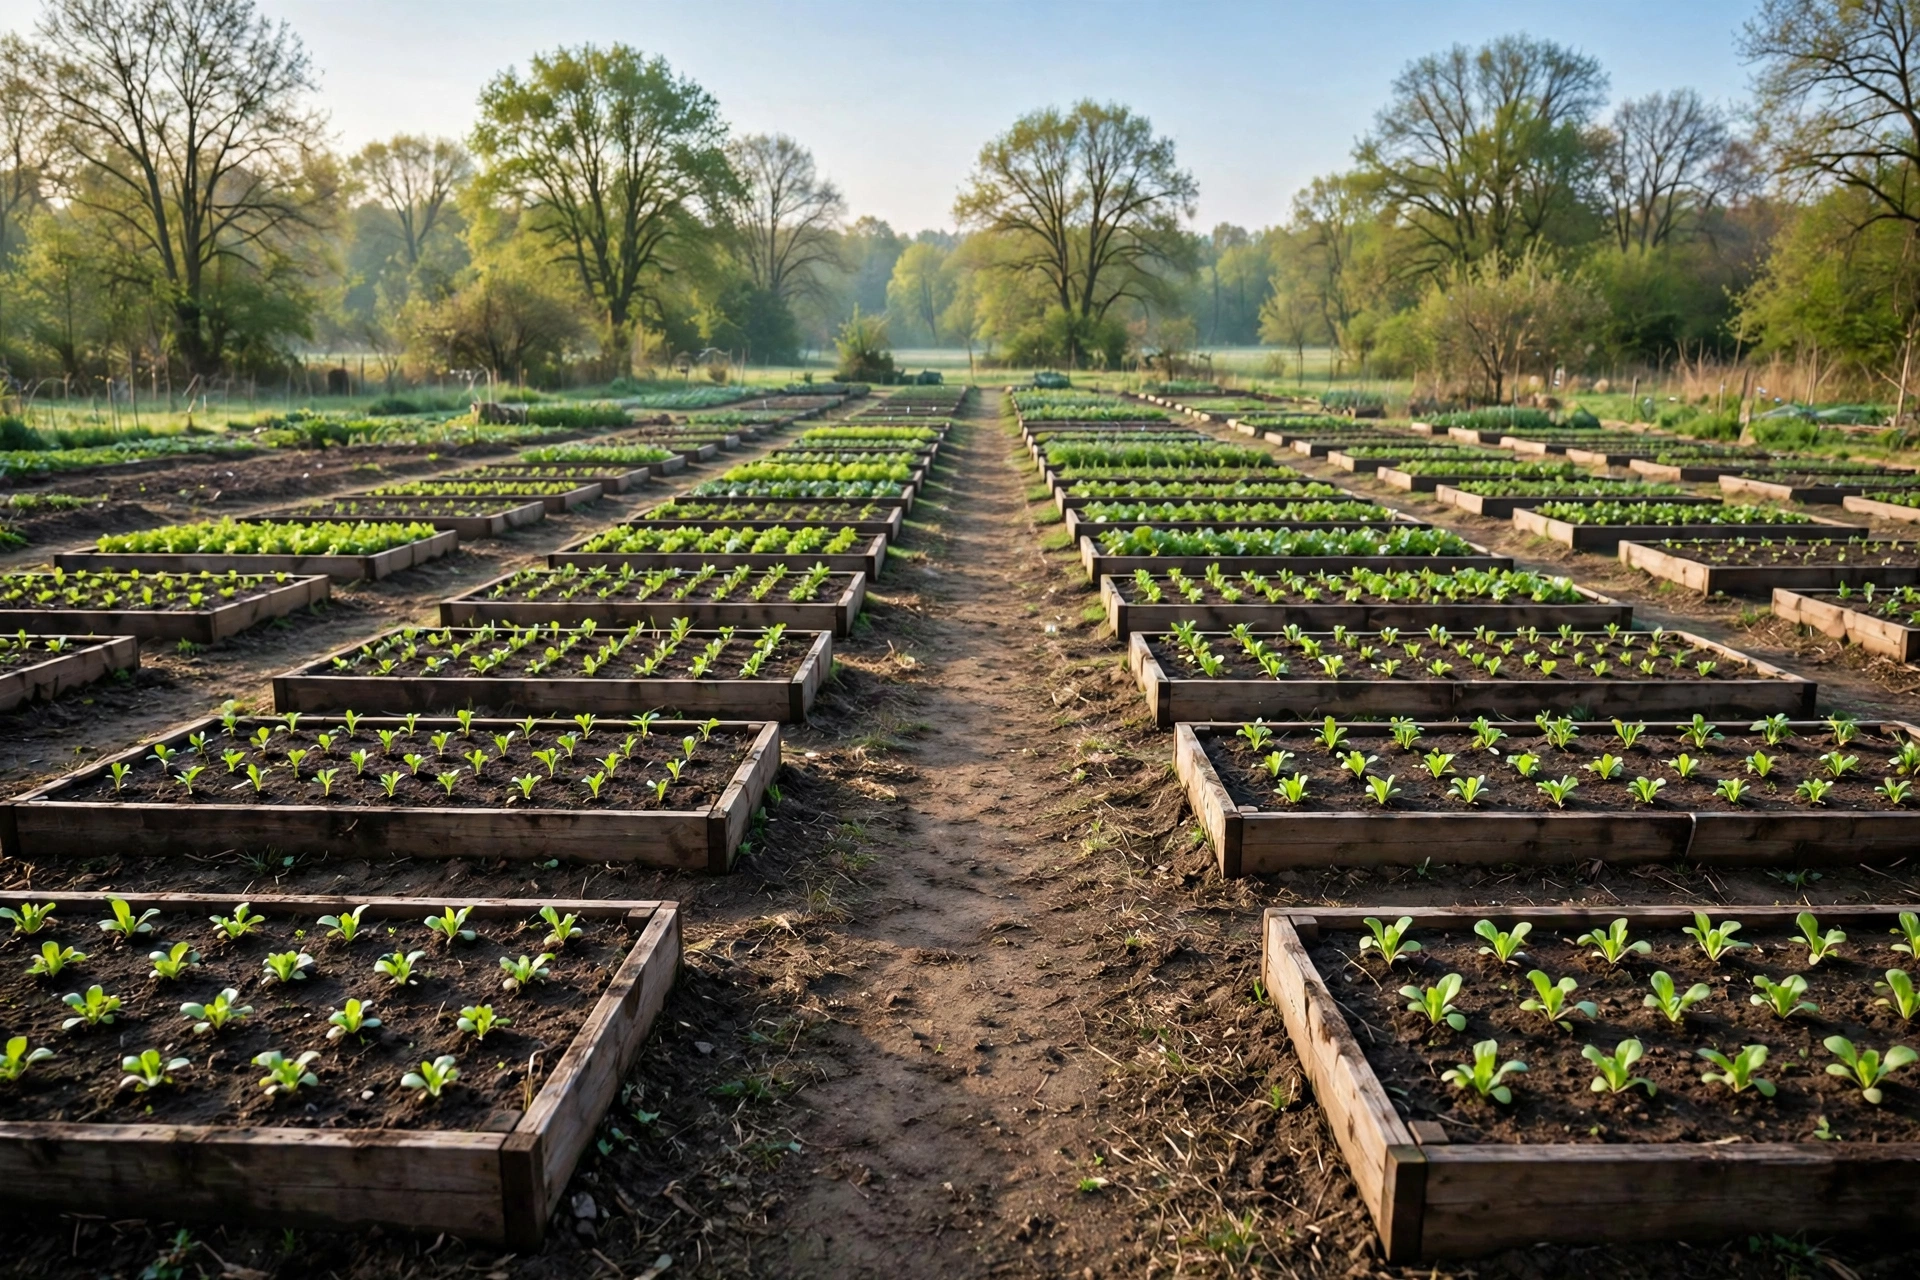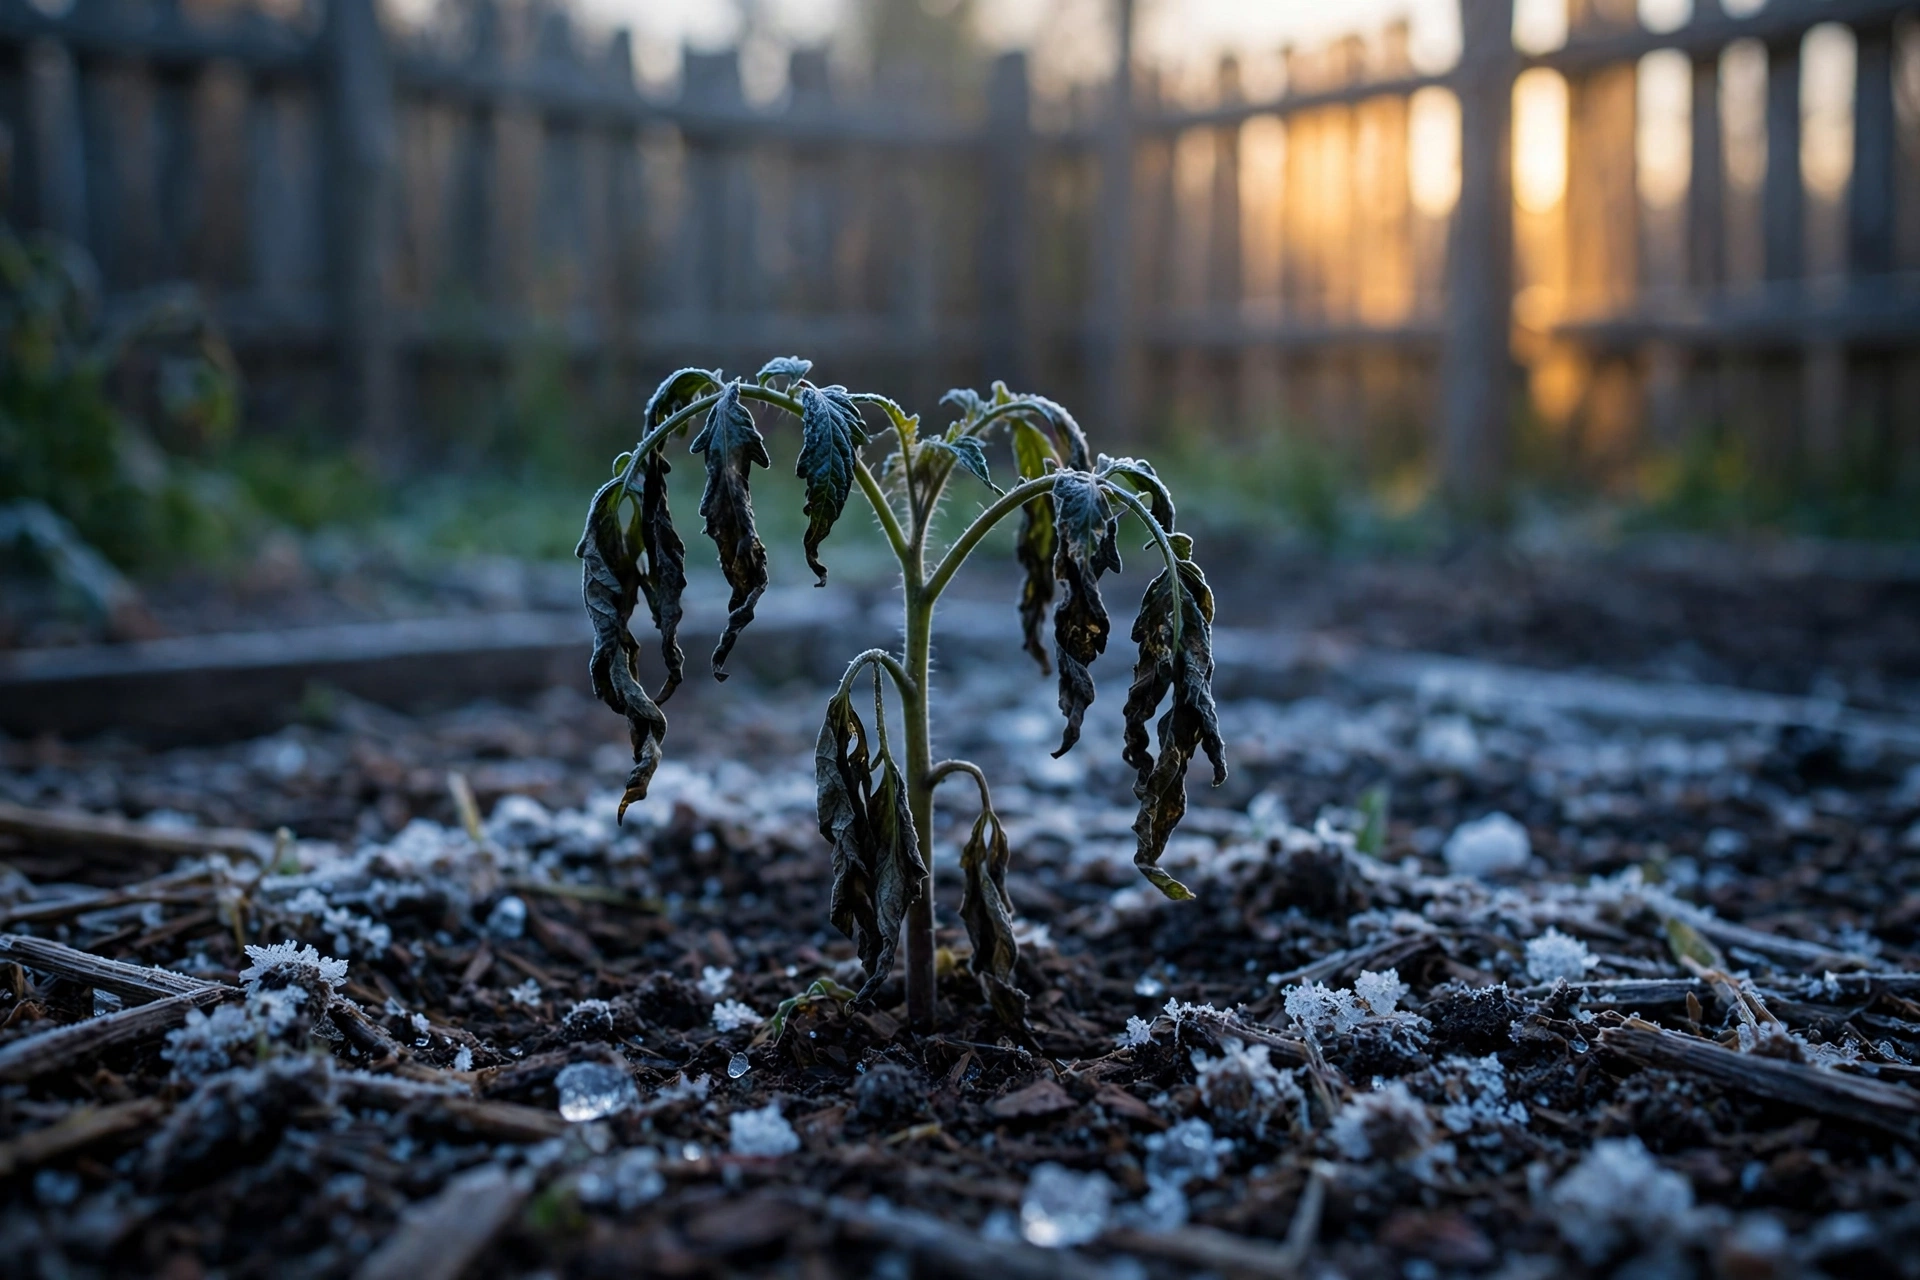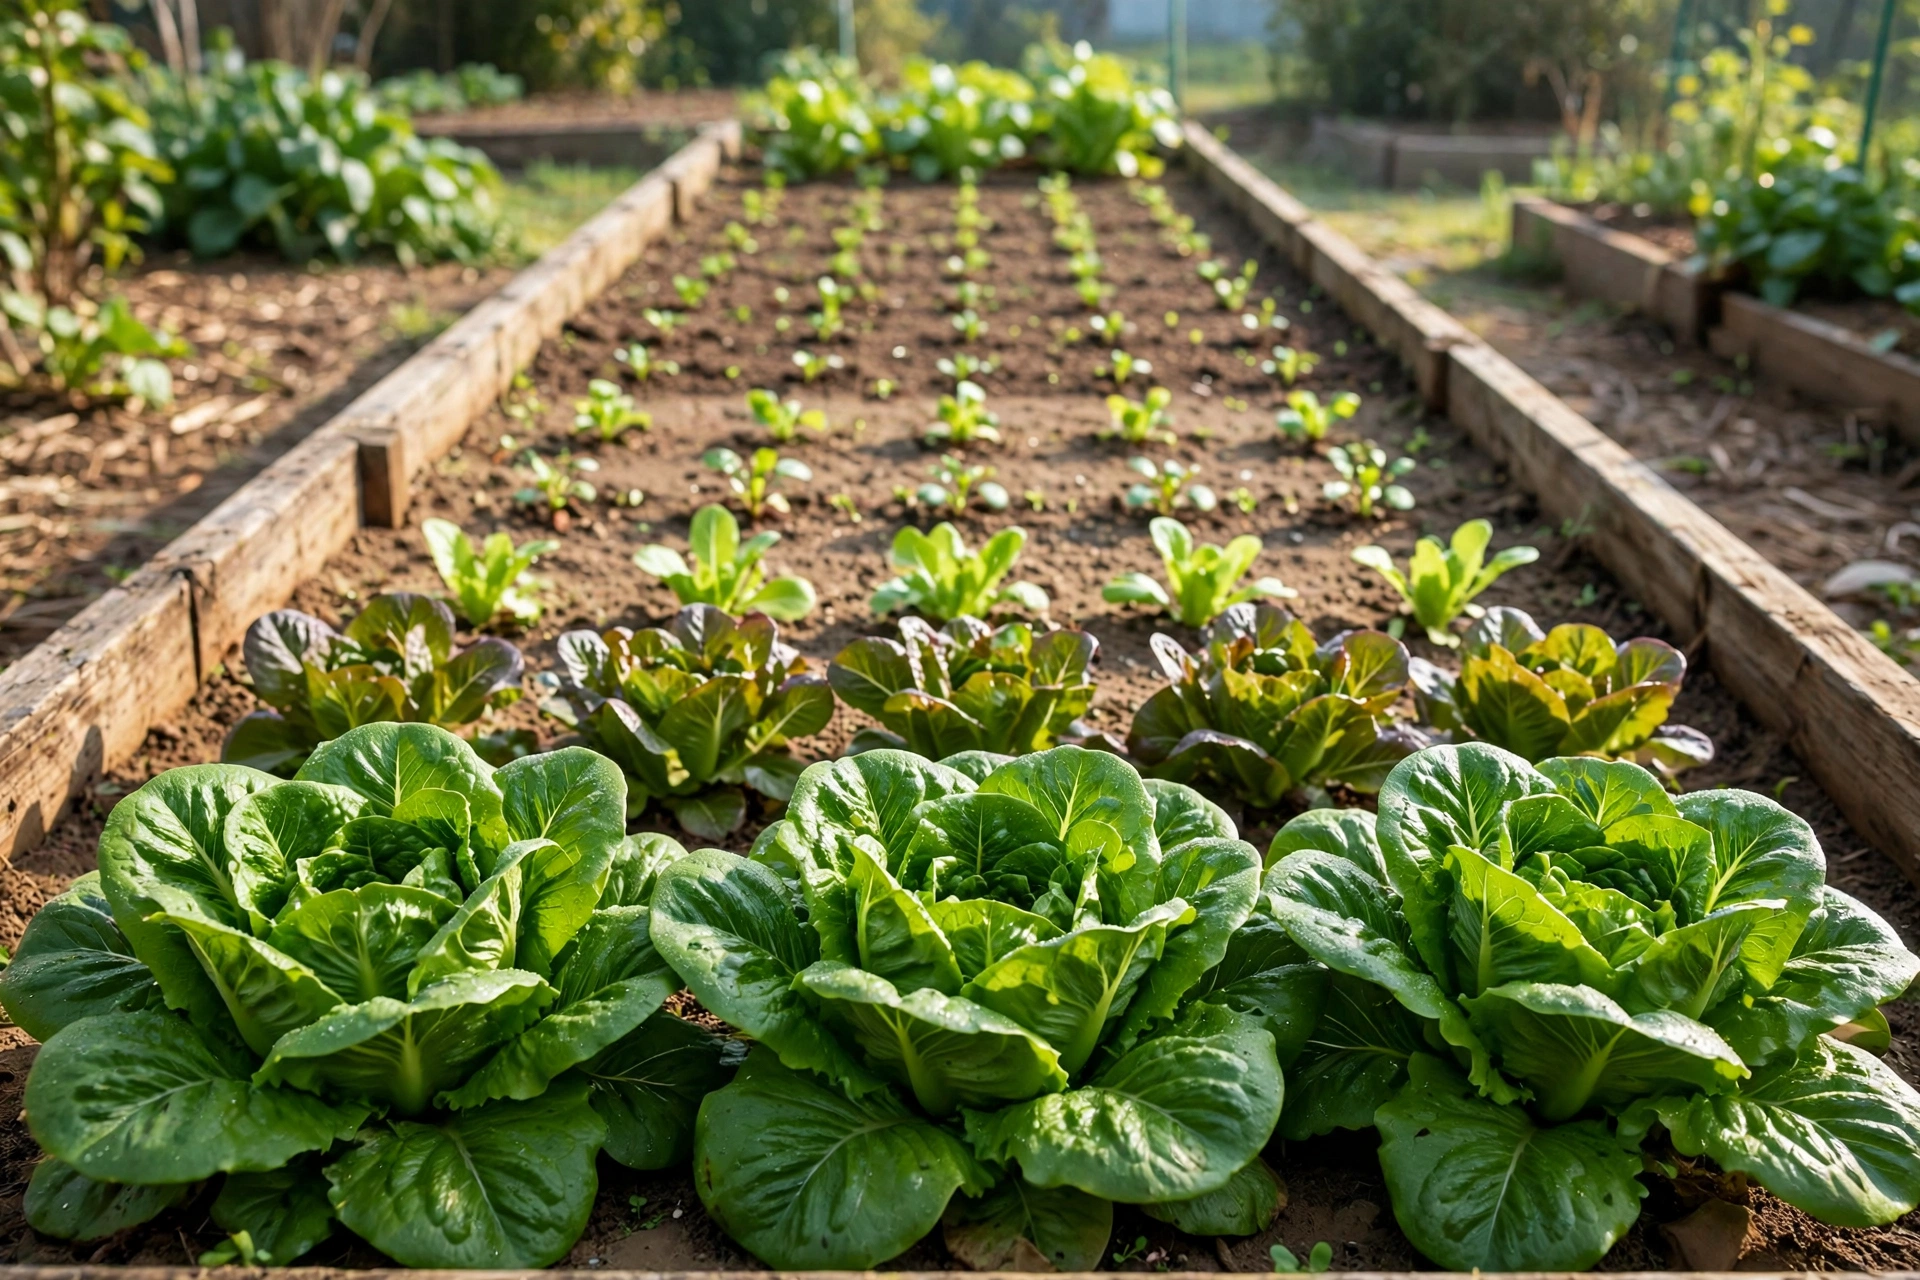
Your average last frost is April 18. So the tomatoes can go out April 19. Right?
That reading of the date — as a finish line, after which frost is simply done — is the most common misunderstanding in vegetable gardening, and it costs more plants than any pest. April 18 is not a promise. It’s the middle of the distribution. In half of all years, the last frost comes after it.
That is not a flaw in the date. That is what the date is. And once you know how frost dates are built and what the numbers actually claim, you can plant with the odds instead of against them — and in a year when you choose to push a planting early anyway, you’ll know exactly how much risk you signed for.
Where a frost date comes from
Frost dates come from NOAA’s U.S. Climate Normals, produced by the National Centers for Environmental Information. For each weather station — there are thousands of them — NOAA takes thirty years of daily temperature records. The current normals cover 1991 through 2020. For every one of those thirty years, it finds the last spring day the temperature fell to the threshold, and the first fall day it fell there again.
Thirty years produce thirty last-frost dates, spread across several weeks. The published “average” is the middle of that spread — the median. In fifteen of the thirty years, the last frost came earlier than that date. In fifteen, it came later. Plant on the average date and the historical odds of another frost still ahead of you are roughly fifty-fifty. A coin flip, conducted in tomatoes.
NOAA also publishes the dates at three thresholds, and the difference is not trivia. The 32-degree date is a light frost. The 28-degree date is a hard freeze. The two can sit a week or more apart at the same station, and different crops care about entirely different lines — the frost tolerance table shows which vegetables shrug off 32 degrees and which are killed by it.
The date nobody prints: when the risk actually drops
Because the median is a coin flip, NOAA publishes frost dates at other probability levels too. The one worth knowing for tender plants is the 10 percent date: the date after which only about one year in ten still sees a later frost.
The gap between the two dates is the honest size of spring’s uncertainty, and it is not small. At Omaha’s Eppley Airfield station, the typical last frost is April 18 — but the date when the risk falls to one in ten is April 30. Twelve days later. At Seattle’s Boeing Field, the typical last frost is March 13 and the one-in-ten date is April 1. Nineteen days. In much of the country, “safe” and “average” are two to three weeks apart. Gardeners who plant to the average while believing they planted to “safe” are the ones replanting in May, every May, wondering what went wrong.
Fall runs the same way in reverse. The average first frost is the date by which half of all years have already frosted. The cautious planning date for a late crop is the early one — the fall frost that arrives ahead of schedule, one year in ten.
Frost is not freeze, and the difference is a row of kale
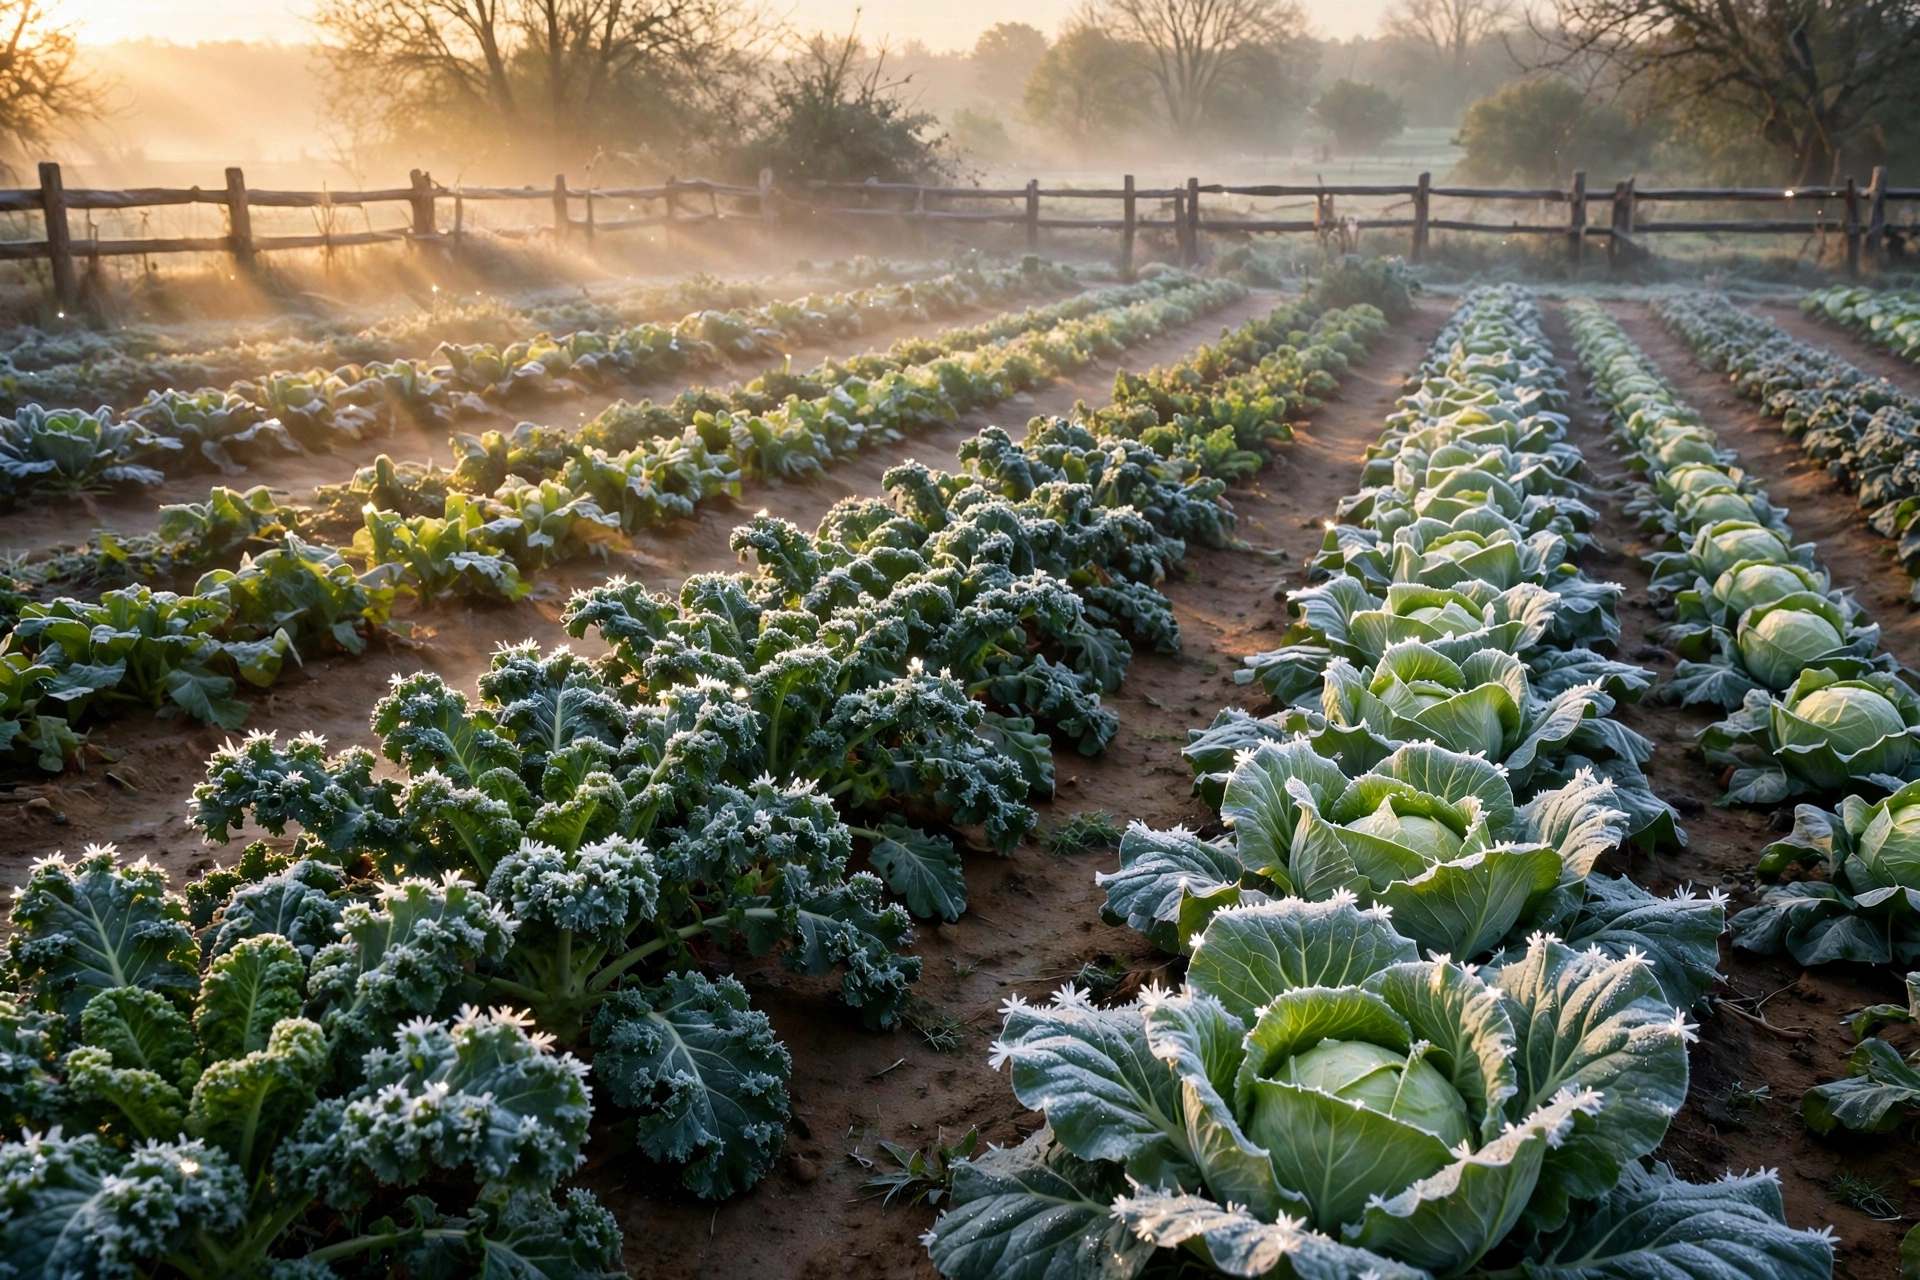
University of Minnesota Extension draws the working distinction. A light frost at 32 degrees can damage tender plants. A hard frost at 28 degrees or colder will kill most warm-season crops. Hardy vegetables — kale, spinach, carrots, peas — take 32 degrees without blinking and keep growing through several hard frosts in fall. Semi-hardy crops land in between.
So a single “frost date” is really three dates wearing one coat, and which one governs depends on what you’re planting. Peas can be scheduled against the 32-degree median with total confidence. Tomatoes should be scheduled against something closer to the 28-degree, one-in-ten line — or planted at the median only by someone who owns a row cover and checks the forecast.
Your yard is not the weather station
Every published date belongs to one station. Often an airport. Possibly miles from your garden, at a different elevation, in different air. Cold air is heavy, and it pools in low ground — a garden at the bottom of a slope frosts on nights when the hilltop garden one street away doesn’t. A south-facing wall stores the day’s heat and hands it back at night. A lake or river nearby blunts both spring and fall extremes. A city garden, wrapped in pavement and brick, can run a week ahead of the farmland outside town.
The spread is real even inside a single county. North Carolina State Extension notes that in Wayne County, published average last-frost dates run from late March to mid-April depending on the dataset — and the actual last frost there has fallen anywhere from mid-March to the beginning of May. Treat the station date as the center of your estimate, then adjust for your own ground. Earlier if you garden high, sheltered, or urban. Later if your beds sit in a low pocket where the cold settles in and stays.
State-level tables narrow this down considerably — Minnesota’s are worked out zone by zone in our Minnesota frost dates — and every calendar in the state planting calendars is anchored to stations inside that state for exactly this reason.
Planting with a probability
None of this makes frost dates useless. It makes them usable — which is a different and better thing. Hardy and semi-hardy crops can go in on the median dates without drama; the worst a late light frost does to kale is slow it down. Tender crops are the ones to schedule like you mean it. Set them out near the one-in-ten date, or plant at the median with the row cover washed, folded, and ready to throw over the bed the evening a frost warning posts.
And in any given week, the forecast outranks the calendar. The normals tell you what thirty years did. The five-day forecast tells you what this week will do. The gardeners who rarely lose a planting check both. The ones who lose plantings are, almost every time, working from a single date they believed was a guarantee. It never was. It was a coin flip with a date printed on it — and now you know how to read the coin.
Sources
- NOAA National Centers for Environmental Information — U.S. Climate Normals, 1991–2020 (freeze/frost probability dates by station and threshold; station examples: Omaha Eppley Airfield, Seattle Boeing Field).
- University of Minnesota Extension — A Minnesota guide to garden timing (light frost at 32°F vs. hard frost at 28°F and their effects).
- North Carolina State Extension — Don’t Plant Too Early! (range of published last-frost dates within one county).